Reliability Heading link
Internal Consistency Reliability
Internal consistency reliability for the QLI (total scale) is supported by Cronbach’s alphas ranging from .73 to .99 across 48 studies (Table 1), and for the four subscales in 24 studies (Table 2). Alphas range from .70 to .94 for the health and functioning subscale, and .78 to .96 for the psychological/spiritual subscale in 24 studies. For the social and economic subscale, alphas were acceptably high 23 studies, ranging from .71 to .92. For the family subscale, alphas range from .63 to .92 in 19 studies.
Temporal (Stability) Reliability
For the total scale, support for temporal reliability was provided by test-retest correlations of .87 with a two-week interval and .81 with a one-month interval (Ferrans & Powers, 1985) and by correlations of .78 with a three to four-week interval (Rustoen et al.,1999). Temporal reliability also was supported by test-retest correlations with a two-week interval for all five scores: overall quality of life (r = .79), health and functioning (r = .72), social and economic (r =.68), psychological/spiritual (r = .76), and family (r = .69) (Dougherty et al., 1998).
Validity Heading link
Content Validity
Content validity of the QLI was supported by the fact that items were based both on an extensive literature review of issues related to quality of life and on the reports of patients regarding the quality of their lives (Ferrans & Powers, 1985). Support for content validity also was provided by an acceptably high rating using the Content Validity Index (Oleson, 1990).
Construct Validity
Convergent validity of the QLI was supported by strong correlations between the overall (total) QLI score and Campbell, Converse, and Rodgers’ (1976) measure of life satisfaction (r = .61, .65, .75, .77, .80, .83, .93) (Bliley & Ferrans, 1993; Ferrans & Powers, 1985; Ferrans & Powers, 1992; Anderson & Ferrans, 1997; Ferrans, 1990).
Further evidence for construct validity was provided by factor analysis. Factor analysis revealed four dimensions underlying the QLI: health and functioning, social and economic, psychological/spiritual, and family. The factor analytic solution explained 91% of the total variance. Factor analysis of the four primary factors revealed one higher order factor, which represented quality of life (Ferrans & Powers, 1992). Rannestad et al. (2000) subsequently performed factor analysis with a group of 284 Norwegian women, which supported the original four factors.
Construct validity also was supported using the contrasted groups approach. Subjects were divided into groups on the basis of self-reported levels of pain, depression, and success in coping with stress. Subjects who had less pain, less depression, or who were coping better with stress had significantly higher overall (total) QLI scores (Ferrans, 1990). The contrasted groups approach also was used to assess the construct validity of the social and economic subscale. It was found that those who had higher incomes had significantly higher quality of life scores on the social and economic subscale (Ferrans & Powers, 1992).
Sensitivity to change/responsiveness Heading link
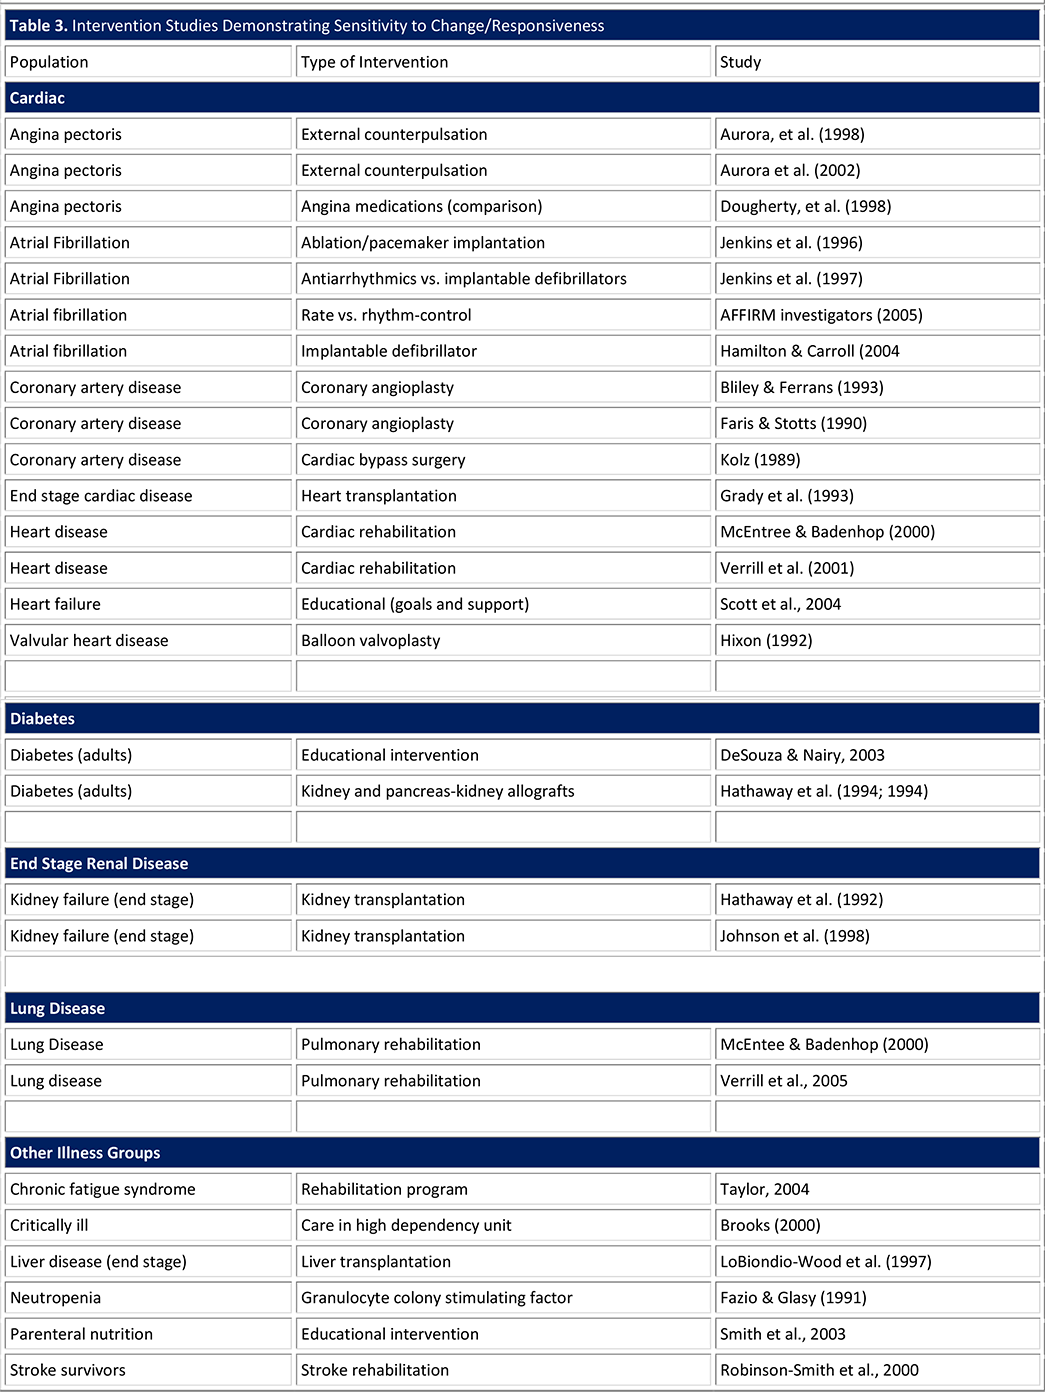
Responsiveness to change (sensitivity) of the QLI has been demonstrated in 27 published intervention studies. In these studies, QLI scores changed significantly over time, when compared before and after an experimental intervention or therapeutic treatment (Table 3).
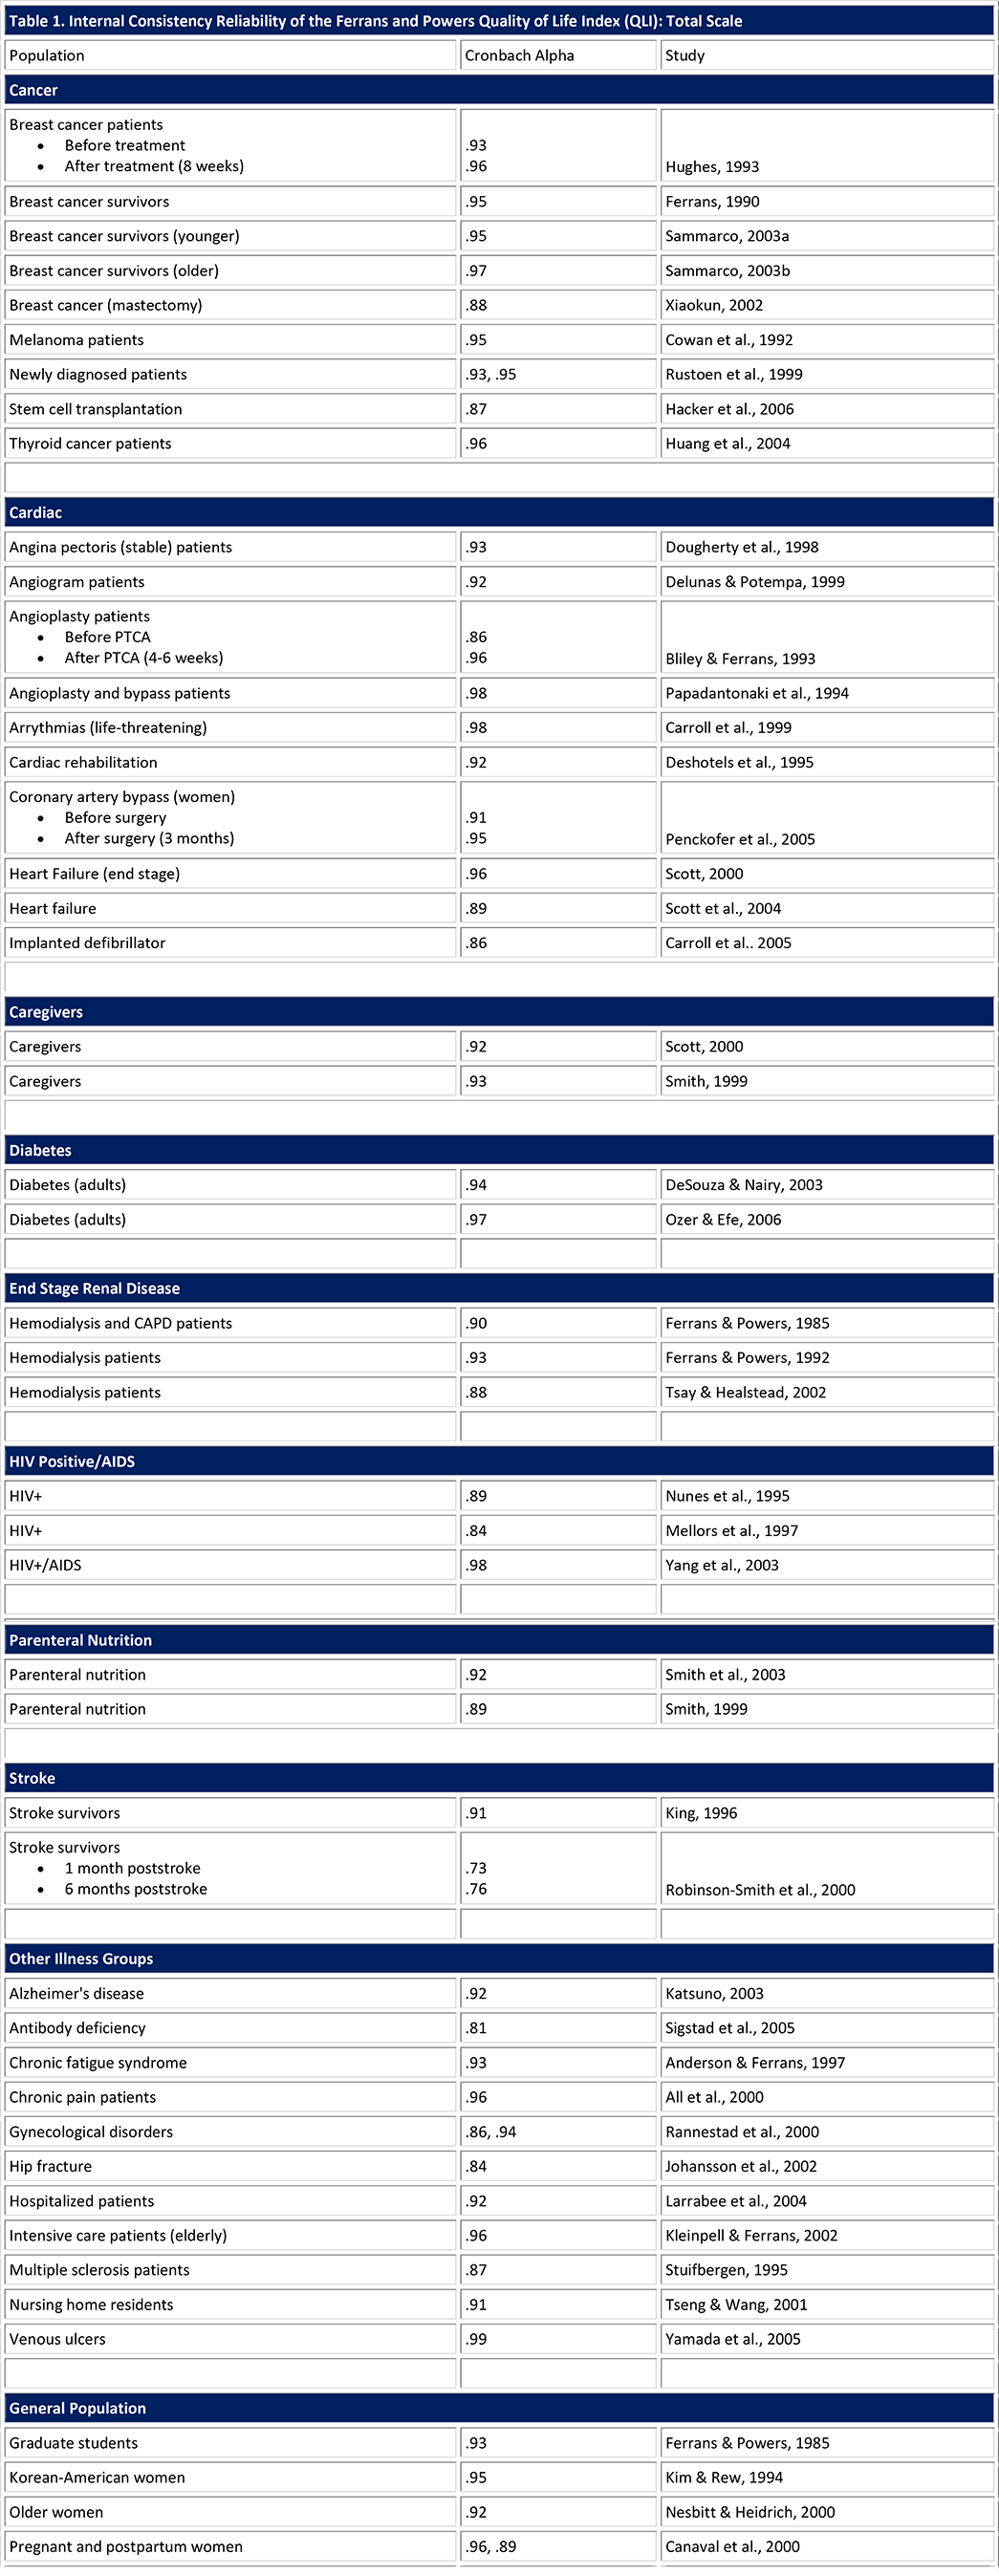
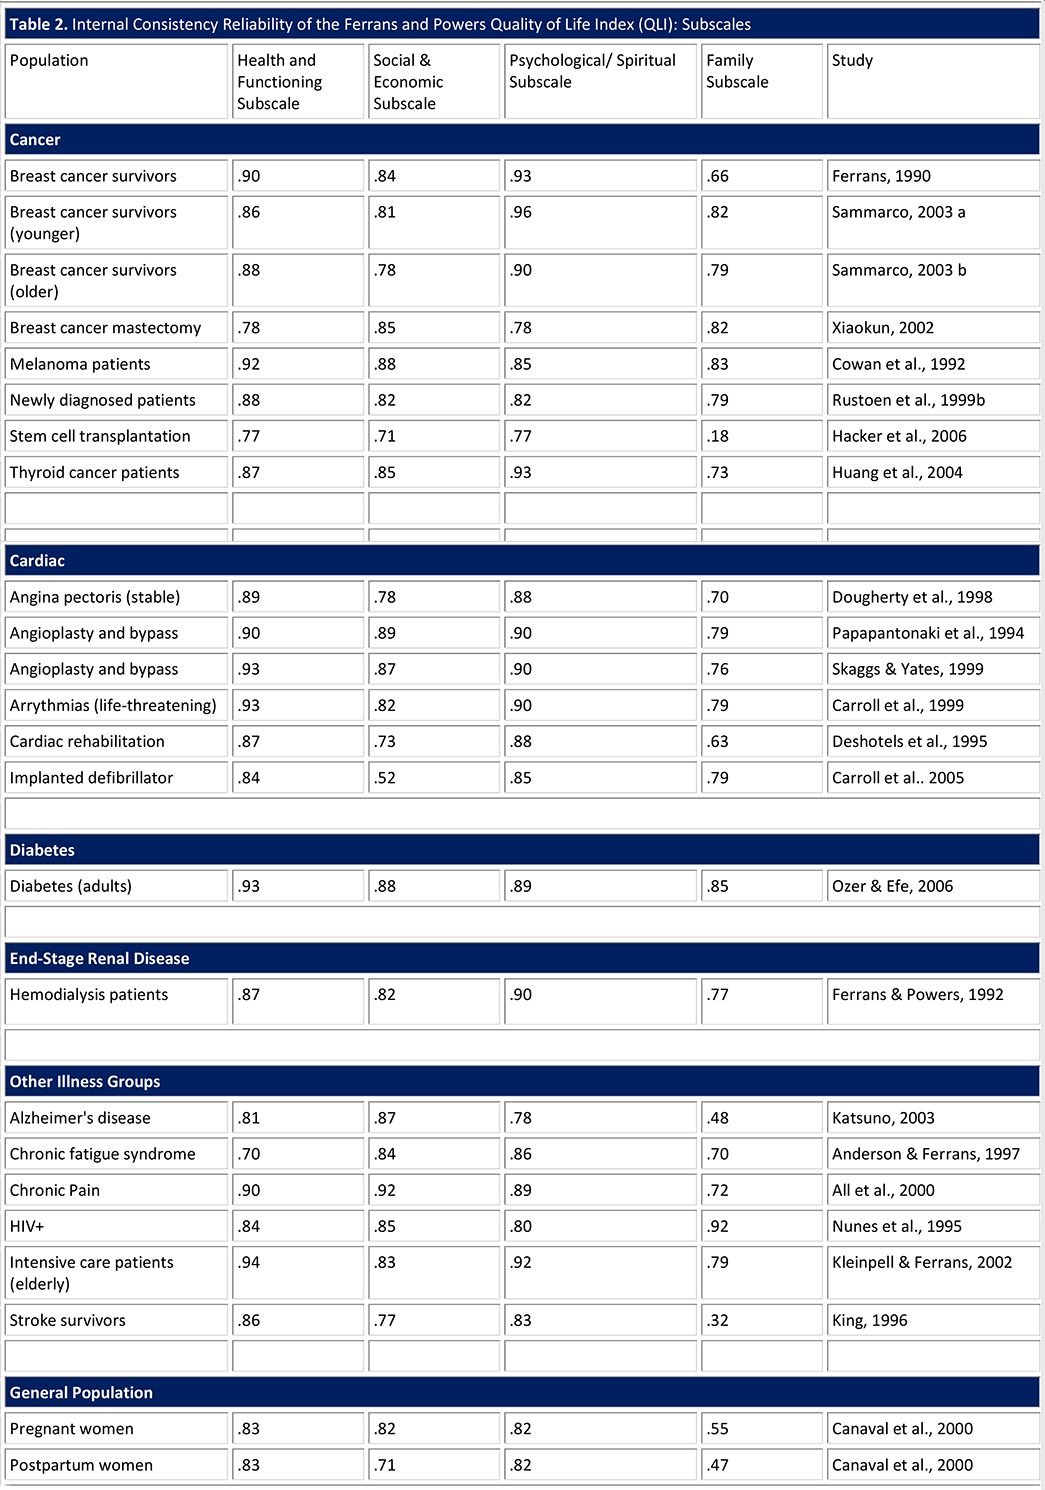
Table 3 Heading link
REFERENCES
Complete reference citations for all the studies listed above are provided on the QLI Research page of this site.